India’s GST Collection for August Soars to ₹1.86 Lakh Crore
 AuthorPriyanka Chaudhari
 Reviewed ByCA Ajay Savani


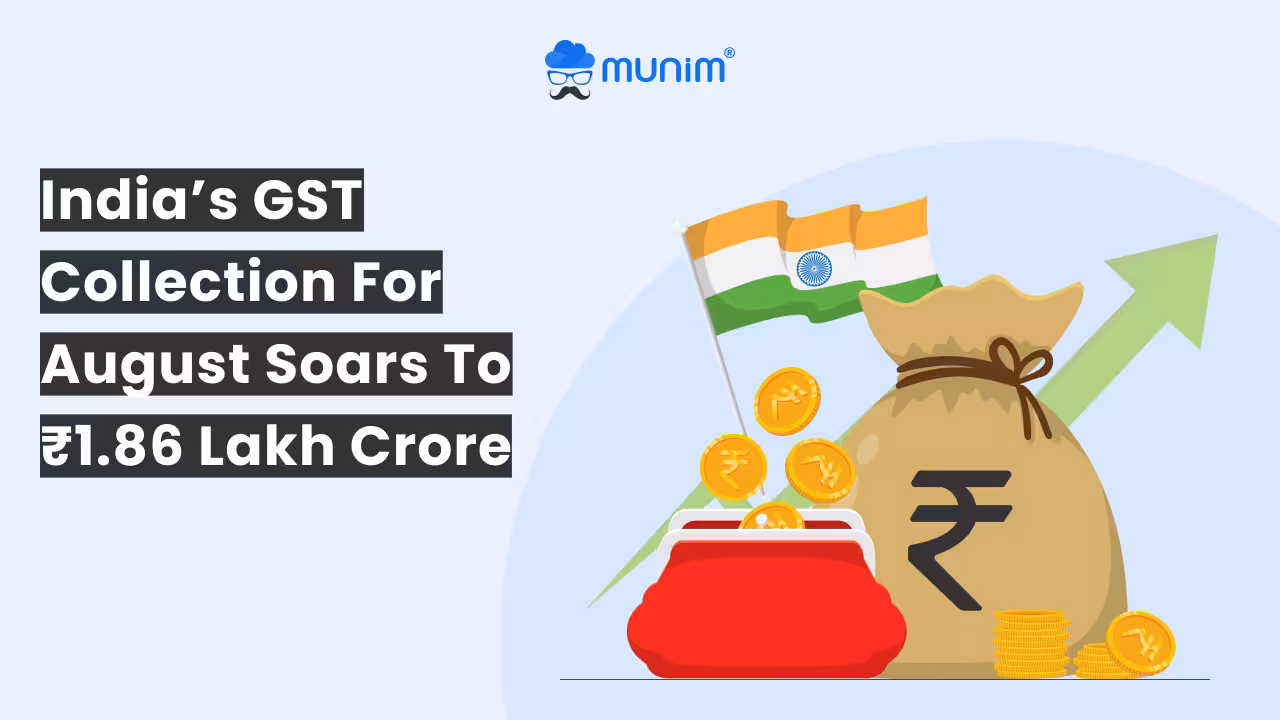
India’s witnesses ₹1.86 lakh crore GST collection in the month of August, depicting an annual rise of 6.5%. The GST collection highlights a consistent revenue inflow, but also signals a moderate growth due to global economic uncertainties and minimized domestic demand.
Let’s see the highlights, trends, state-wise analysis, and refunds.
GST Collection For August 2025: Key Breakdown!
The net GST revenue after refunds touched ₹1.67 trillion, showing an annual growth of nearly 10.7%. Let’s see the highlights for the GST collection in August 2025.
| August 2024 | August 2025 | |
| Gross GST Collections | ₹1,74,962 Cr | ₹1,86,315 Cr |
| Domestic Revenue | ₹1,24,98 Cr | ₹1,36,962 Cr |
| Imports | ₹49,976 Cr | ₹49,354 Cr |
| CGST | ₹30,862 Cr | ₹34,076 Cr |
| SGST | ₹38,411Cr | ₹42,854 Cr |
| IGST | ₹44,593 Cr | ₹48,639 Cr |
| CESS | ₹11,120 Cr | ₹11,392 Cr |
GST Collection for August 2025: Refund Highlights!
GST refunds for August 2025 stood at ₹19,359 crore, showing a decline of 19.9% compared to August 2024. Of this, refunds from imports were ₹8,346 crore, lower by 17.9% year-on-year.
The domestic refunds fell by 21.4% reaching ₹11,014 Cr for August.
Let’s quickly check the GST refund highlights for August 2025!
| GST Refunds | August 2024 | August 2025 |
| CGST | ₹3,588 Cr | ₹2,602 Cr |
| SGST | ₹4,371 Cr | ₹3,118 Cr |
| IGST | ₹15,675 Cr | ₹13,222 Cr |
| CESS | ₹537 Cr | ₹417 Cr |
GST Collections for August 2025 – Statewise Breakdown!
Maharashtra topped the GST chart in GST collection for August 2025 with ₹28,900 crore, recording 10% growth over the previous year. The next biggest contributors were Karnataka, Tamil Nadu, and Gujarat.
While some states show a rise in collection, there are a few that have witnessed a downfall, too. Among the states showing a decline are Chandigarh (-12%), Manipur (-24%), Jharkhand (-1%), Lakshadweep (-66%), and Puducherry (-4%).
| State / UT | Aug-24 in Cr | Aug-25 in Cr | Growth (%) |
| Jammu and Kashmir | 569 | 582 | 2% |
| Himachal Pradesh | 827 | 871 | 5% |
| Punjab | 1,936 | 2,199 | 14% |
| Chandigarh | 244 | 214 | -12% |
| Uttarakhand | 1,351 | 1,448 | 7% |
| Haryana | 8,623 | 9,681 | 12% |
| Delhi | 5,635 | 5,725 | 2% |
| Rajasthan | 3,820 | 4,342 | 14% |
| Uttar Pradesh | 8,269 | 9,086 | 10% |
| Bihar | 1,491 | 1,717 | 15% |
| Sikkim | 326 | 454 | 39% |
| Arunachal Pradesh | 74 | 88 | 20% |
| Nagaland | 42 | 56 | 33% |
| Manipur | 56 | 42 | -24% |
| Mizoram | 28 | 30 | 8% |
| Tripura | 85 | 87 | 2% |
| Meghalaya | 155 | 209 | 35% |
| Assam | 1,353 | 1,496 | 11% |
| West Bengal | 5,077 | 5,473 | 8% |
| Jharkhand | 2,850 | 2,820 | -1% |
| Odisha | 4,878 | 5,030 | 3% |
| Chhattisgarh | 2,611 | 2,809 | 8% |
| Madhya Pradesh | 3,438 | 3,731 | 9% |
| Gujarat | 10,344 | 10,992 | 6% |
| Dadra & Nagar Haveli and Daman & Diu | 320 | 365 | 14% |
| Maharashtra | 26,367 | 28,900 | 10% |
| Karnataka | 12,344 | 14,204 | 15% |
| Goa | 531 | 545 | 3% |
| Lakshadweep | 2 | 1 | -66% |
| Kerala | 2,511 | 2,723 | 8% |
| Tamil Nadu | 10,181 | 11,057 | 9% |
| Puducherry | 234 | 225 | -4% |
| Andaman and Nicobar Islands | 27 | 37 | 35% |
| Telangana | 4,569 | 5,103 | 12% |
| Andhra Pradesh | 3,298 | 3,989 | 21% |
| Ladakh | 33 | 35 | 6% |
| Other Territory | 199 | 200 | 0% |
| Center Jurisdiction | 288 | 396 | 38% |
| Grand Total | 1,24,986 | 1,36,962 | 10% |
Comparing SGST for Every State Based on Pre and Post Settlements!
| State / UT | Pre-SGST 2024-25 | Pre-SGST 2025-26 | Growth | Post-SGST2 2024-25 | Post-SGST2 2025-26 | Growth |
| Jammu and Kashmir | 1,289 | 1,252 | -3% | 3,717 | 3,366 | -9% |
| Himachal Pradesh | 1,172 | 1,187 | 1% | 2,604 | 2,640 | 1% |
| Punjab | 3,890 | 4,229 | 9% | 9,464 | 10,960 | 16% |
| Chandigarh | 316 | 318 | 0% | 950 | 942 | -1% |
| Uttarakhand | 2,507 | 2,806 | 12% | 3,880 | 4,235 | 9% |
| Haryana | 9,664 | 10,762 | 11% | 16,251 | 19,174 | 18% |
| Delhi | 7,342 | 8,709 | 19% | 14,804 | 16,232 | 10% |
| Rajasthan | 7,569 | 8,243 | 9% | 17,479 | 18,588 | 6% |
| Uttar Pradesh | 15,146 | 15,908 | 5% | 35,512 | 35,220 | -1% |
| Bihar | 3,768 | 4,463 | 18% | 11,768 | 12,883 | 9% |
| Sikkim | 165 | 250 | 52% | 410 | 523 | 28% |
| Arunachal Pradesh | 263 | 372 | 42% | 811 | 968 | 19% |
| Nagaland | 125 | 186 | 49% | 451 | 536 | 19% |
| Manipur | 181 | 180 | -1% | 537 | 473 | -12% |
| Mizoram | 138 | 101 | -27% | 428 | 394 | -8% |
| Tripura | 227 | 250 | 10% | 739 | 707 | -4% |
| Meghalaya | 268 | 302 | 13% | 772 | 732 | -5% |
| Assam | 2,709 | 3,024 | 12% | 6,494 | 6,517 | 0% |
| West Bengal | 10,313 | 10,801 | 5% | 18,825 | 19,132 | 2% |
| Jharkhand | 3,719 | 4,115 | 11% | 5,845 | 6,378 | 9% |
| Odisha | 7,816 | 7,879 | 1% | 11,156 | 10,221 | -8% |
| Chhattisgarh | 3,674 | 3,900 | 6% | 6,162 | 6,071 | -1% |
| Madhya Pradesh | 5,783 | 6,443 | 11% | 14,906 | 14,870 | 0% |
| Gujarat | 18,925 | 20,857 | 10% | 29,423 | 32,396 | 10% |
| Dadra & Nagar Haveli and Daman & Diu | 317 | 326 | 3% | 517 | 450 | -13% |
| Maharashtra | 46,588 | 51,189 | 10% | 69,274 | 78,537 | 13% |
| Karnataka | 18,631 | 21,084 | 13% | 33,330 | 34,846 | 5% |
| Goa | 1,068 | 1,085 | 2% | 1,770 | 1,808 | 2% |
| Lakshadweep | 3 | 4 | 40% | 39 | 41 | 5% |
| Kerala | 6,034 | 6,511 | 8% | 13,252 | 13,319 | 1% |
| Tamil Nadu | 18,535 | 20,344 | 10% | 31,338 | 31,849 | 2% |
| Puducherry | 225 | 243 | 8% | 599 | 557 | -7% |
| Andaman and Nicobar Islands | 95 | 100 | 5% | 257 | 293 | 14% |
| Telangana | 8,437 | 9,166 | 9% | 17,664 | 18,361 | 4% |
| Andhra Pradesh | 6,147 | 6,617 | 8% | 13,797 | 13,886 | 1% |
| Ladakh | 90 | 103 | 14% | 270 | 282 | 4% |
| Other Territory | 80 | 149 | 85% | 372 | 645 | 73% |
| Grand Total | 2,13,219 | 2,33,456 | 9% | 3,95,867 | 4,19,033 | 6% |
Let’s Conclude!
India’s GST Collection for August 2025 surges to ₹1.86 lakh crore, showing a silent 6.5% YOY rise. This signals steady revenue inflows with moderate consumption. While net revenue shows double-digit growth, refunds have witnessed a sharp fall due to shifts in domestic demands and global uncertainties.
Overall, August’s GST collections depict a steady growth compared to earlier high-performing months. Save the blog and stay tuned with us until we come up with new updates.
Disclaimer: "This blog post is for informational purposes only. For specific tax advice related to your business, please consult a qualified Chartered Accountant or GST practitioner."
About the author
Post Tags
Related Articles
Explore the latest market news, useful resources for business, and Munim updates.